We have long known that urban trees help mitigate air pollution. But what about questions of how significant that mitigation is, how we track it, and where it occurs? A 2014 paper, “Assessing the relationship among urban trees, nitrogen dioxide, and respiratory health” by Linda George, Meenkashi Rao, Todd Rosenstiel, Vivek Shandas, and Alexis Dinno examined these questions relative to nitrogen dioxide pollution in Portland, OR. Their results are fascinating, and suggest that in-situ measurements predict “significantly higher reduction of NO2 by urban trees than do existing models.” What does this really mean – and what is the implication for eco-benefits tools like i-Tree? I spoke to Linda George to learn more about their study, what people seeking to quantify urban tree benefits need to know, and what designers and policymakers should be considering as we look to a denser and more urbanized future. Our conversation has been edited and condensed. –LM
Your paper is called “Assessing the relationship among urban trees, nitrogen dioxide, and respiratory health” – why were you interested in this topic?
It started over a decade ago, and honestly, at that time my focus was entirely on the chemistry of pollution in the atmosphere – I’m an atmospheric chemist and I wasn’t thinking much about the sources on the bottom, nor was I interested in them. Then an environmental justice group here in Portland approached me asking for my help understanding the likely impact to nearby residents of expanding the I-5 highway north. That was when my interest in neighborhood scale sources of pollution – and mitigation – started.
What did you find?
First, let me explain that making measurements of air pollution generally requires very expensive equipment, so in this case, making a spatially-intensive assessment using standard methods was basically out of the question. But I stumbled on a low-cost, but accurate way to measure Nitrogen Dioxide (NO2) and decided to try it out, although I wasn’t really expecting all that much to come of it. Unlike the standard method, this low cost method isn’t a continuous measurement but gives us a snapshot of the concentration over a two-week period.
During the course of working with the environmental justice group, I was surprised to hear public officials at meetings I attended about the project claim that pollutants disappeared completely, or were unimportant, once they were 25 feet from the source, which seemed very unlikely to me.
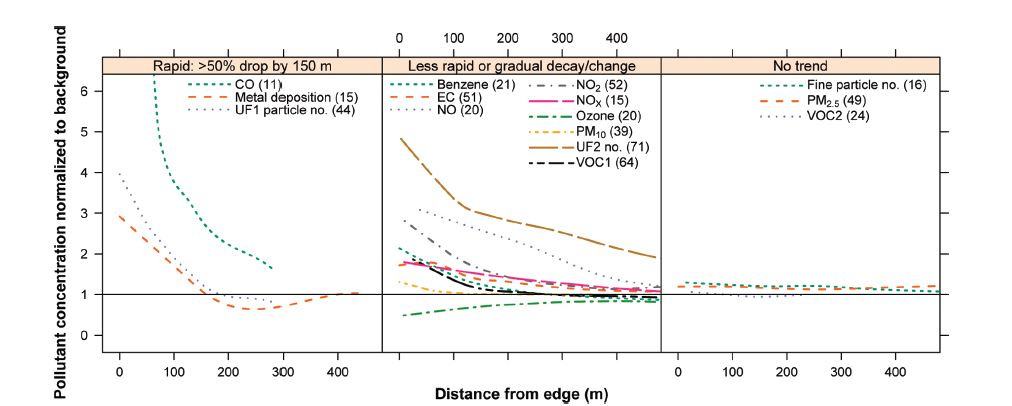
Changes in pollutant concentrations over distance. Rapid initial concentration decay, defined here as at least a 50% decrease in peak concentration by 150 m, followed by more gradual decay toward background. The second consistently decayed or changed over the entire distance range, while the third showed no trend with distance.
Graph courtesy of A. Karner et al. / Environ. Sci. Technol. 2010, 44, 5334–5344.